
What Did Your Money Actually Earn? Now Every Broker, One Answer
RetireOdds now computes time-weighted and money-weighted returns across all your accounts from the monthly statements you already upload.

Every January we used to play the same unsatisfying game: log into three brokerages, squint at three different "performance" numbers computed three different ways over three different periods, and try to guess what our money actually did last year. Schwab said one thing, the 401(k) provider said another, and neither number accounted for the cash we had moved in and out. Mayur kept a spreadsheet for a while. The spreadsheet lied too, just more politely — because a portfolio that received a big contribution in March will look brilliant by December even if the investments themselves went nowhere.
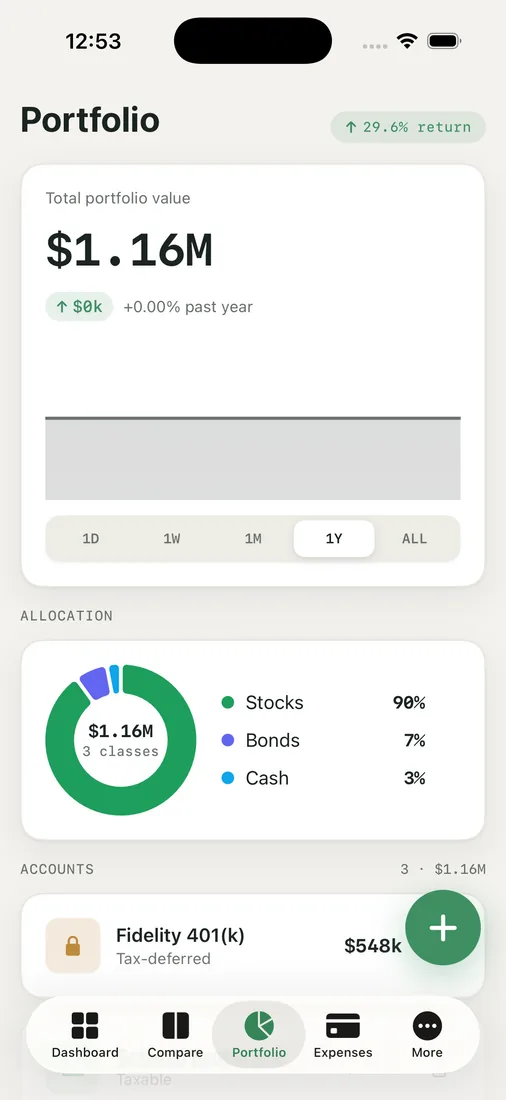
That is the problem the new Performance card on the Portfolio page is built to solve, and it works from something you were probably already doing: uploading a positions CSV from each broker once a month.
Two numbers, because there are two questions
The card leads with two returns, and the difference between them is the whole point.
Time-weighted return (TWR) strips out the effect of your deposits and withdrawals. It answers: how good were the investments? This is the number you can fairly compare to an index — the card puts SPY and AGG next to it over the exact months your data covers.
Money-weighted return (XIRR) includes the size and timing of every cash flow. It answers: how did my actual dollars grow, per year? Add money right before a rally and XIRR rises while TWR does not flinch. Both are real questions; conflating them is how spreadsheets lie.
The monthly rhythm
Each statement you import becomes a dated checkpoint — the account's value on the statement date, not the day you happened to upload it. Between checkpoints, RetireOdds asks the questions a fiduciary would ask: did money move in or out? Did a position that disappeared get sold, and for what proceeds and basis? Is any cost basis missing?
Every question is skippable, and this matters: a skipped month is assumed to have zero flows, and the card says so out loud with an amber row you can click later to fill in the truth. No silent precision. The disclosure list under "How these numbers work" spells out every approximation — flows dated at period midpoints, benchmark based on adjusted close, returns nominal and pre-tax.

For a household like ours with accounts scattered across brokers, the consolidated view is the part we had never had before: one TWR, one XIRR, contributions and withdrawals and dividends and fees totaled across everything, plus realized and unrealized gains and a cost-basis quality check that tells you how trustworthy the gain figures are.
Guardrails we refused to skip
Two design decisions are worth calling out, because they are the difference between a toy and a tool. First, short windows show a dash instead of a number when the data cannot honestly support them — a return labeled "3M" is computed over three months trailing your last statement, or not at all. Second, an old statement cannot be imported over your live portfolio; history is recorded through manual checkpoints that never touch today's holdings. We would rather show you nothing than show you something wrong.
Key takeaways
- Import a positions CSV monthly and RetireOdds builds consolidated time-weighted and money-weighted returns across every account.
- TWR judges the investments; XIRR judges your actual dollars. You need both, and they are not the same number.
- Skipped review questions are disclosed as assumptions, never silently treated as fact.
- Benchmarks (SPY, AGG) cover the same months as your data — no apples-to-oranges comparisons.
The Performance guide in the Help Center walks through the full workflow, and if you have been tracking with a spreadsheet, one month of statements is all it takes to start.


