
RetireOdds vs Boldin: Which Retirement Planner Shows Its Work?
Boldin is a genuinely good planner with a decade of features behind it. Here is where the two tools actually differ — and why we built the Ledger the way we did.
Two things are true at once. Boldin — the tool formerly called NewRetirement — is one of the best retirement planners you can buy, and it is not the tool we wanted for our own plan. This guide explains the difference precisely enough that you can decide which description fits you, including the parts where Boldin is straightforwardly the better answer.
We build RetireOdds, so read this the way you would read any comparison written by one side: check the claims. Everything we say about our own product is visible in the app on a free trial, and everything we say about Boldin links to their own pages.
The short version
| RetireOdds | Boldin (PlannerPlus) | |
|---|---|---|
| Core model | Monte Carlo odds + a deterministic year-by-year Ledger from the same engine | Monte Carlo analysis (1,000 iterations) plus detailed projections |
| Where the detail lives | One scrollable table: every year, every bucket, every tax line | Dozens of interactive charts across cash flow, taxes, RMDs, IRMAA |
| Auditability | Every money cell traces backward to its cause and forward to what it changes | Charts and reports; assumptions editable across scenarios |
| Human help | None — the model is the product | Plan coaches and CERTIFIED FINANCIAL PLANNER™ sessions available |
| Scenarios | Saved plans, compared side by side, with a plan audit pack | Up to 10 scenarios compared side by side |
| Account linking | Optional — import holdings and expenses, or type them | Yes, via Plaid and other aggregators |
| Price (Aug 2026) | Free trial, then $69/yr or $199 once | Free Basic tier, then $144/yr |
Prices are list prices we checked on 1 August 2026 and they change — Boldin's pricing page and ours are the sources of truth.
Where Boldin is the better tool
We would rather tell you this up front than have you discover it after a trial.
You want a human in the loop. Boldin will match you with a plan coach or a CFP. That is a real, substantial thing that software cannot replace, and we do not offer it. If your honest blocker is "I don't trust myself to interpret this," a coaching session is worth more than any feature comparison.
You want maximum input surface. Boldin has had a decade to accumulate fields — the long tail of pensions, annuities, insurance products, part-time work patterns, rental property detail. If your situation lives in that long tail, Boldin will likely hold it without a workaround.
You want everything linked automatically. Boldin leans on account aggregation to keep balances current. RetireOdds imports too, but our design assumption is that a plan is mostly a handful of numbers you should understand, not a live feed you watch.
Where the two genuinely differ: the output, not the input
Most planners compete on inputs — how many kinds of income can you model, how many account types. The thing that changed our own planning was not another input field. It was being able to answer why about a number in the output.
Here is the problem we had. A planner tells you 87%. Then it shows you charts. The charts are downstream of a simulation, and the simulation is downstream of assumptions, and somewhere in that chain is the answer to the question you actually have, which is usually something like: why does 2038 look bad?
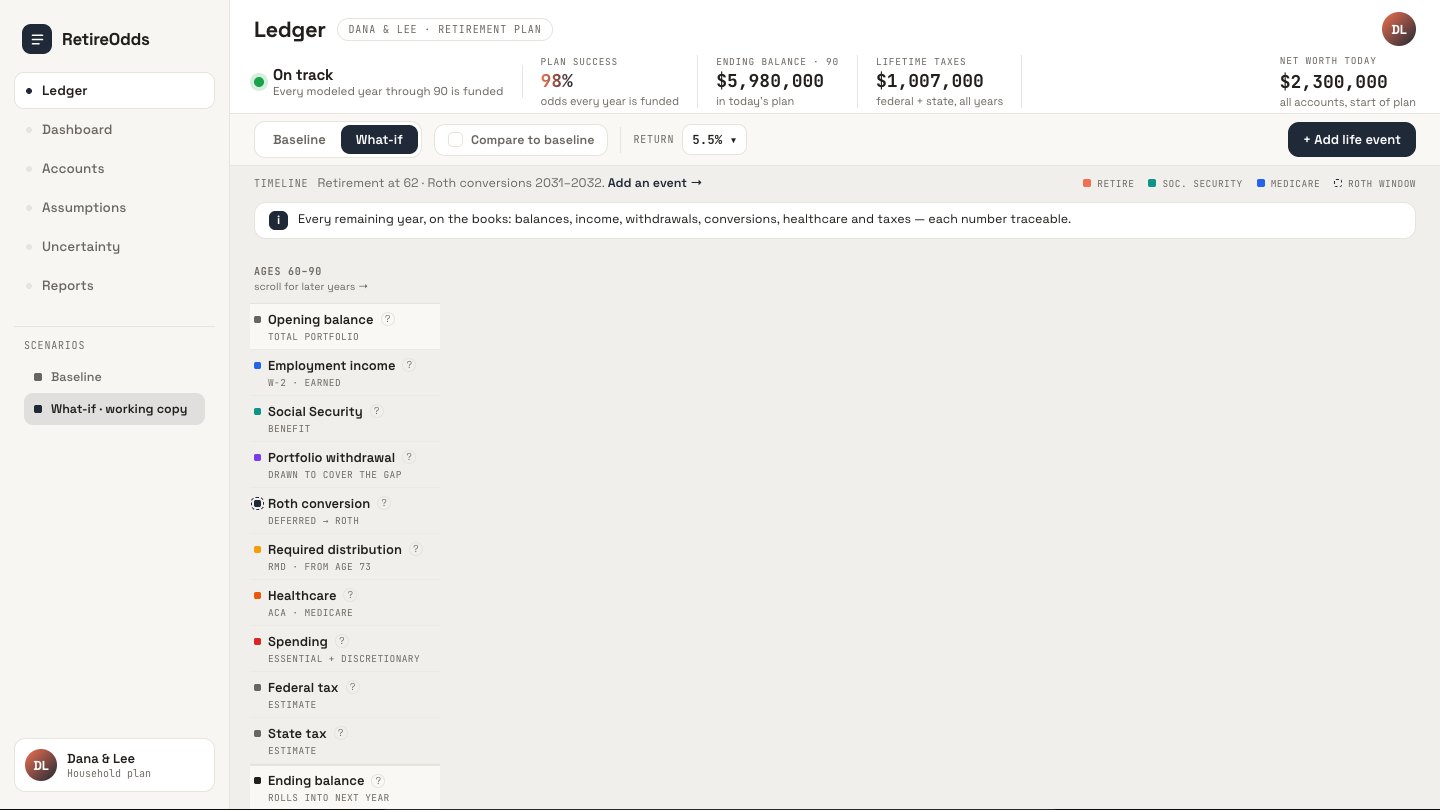
The Ledger is our answer. It lays your plan out year by year — income, Social Security, withdrawals split by tax bucket, taxes, healthcare, spending, and the balance you end each year with — in today's dollars, so a figure in 2045 means the same thing as one this year.
Three properties matter more than the layout: It is the same engine, not a parallel guess. The Ledger is the deterministic median path of the exact simulation that produces your odds. The table and the percentage cannot quietly disagree about the return you assumed, the spending you assumed, or the tax rules applied. In tools where the projection and the probability are computed separately, that agreement is a hope rather than a guarantee.
Every number shows its work. Click a figure and you get its cause and its consequences — the coral cells that produced it, the dashed cells it goes on to change. In the sample plan above, a $40,000 Roth conversion in 2033 pushes federal tax from $3,815 to $9,502, and because 2033 sits in the pre-Medicare window it also trims the premium tax credit, adding $5,200 in healthcare cost that year. That second effect is exactly the sort of thing a single-line tax estimate misses.
Setup problems are stated, not buried. The Ledger carries explicit warnings when your inputs cannot support a clean answer — an opening balance it could not reconcile, an alternative asset with no valuation basis. A plan that quietly fills gaps with defaults produces a confident number you should not trust.
Grounded in what you actually spend
The other half of "real data" is the input side, and this is where a retirement number usually goes wrong. Most plans start with a spending assumption someone typed once — "we'll need $6,000 a month" — and never revisit it.
RetireOdds tracks real expenses, on the phone, in whatever currency you are standing in: scan a receipt and the line items are read on-device, say it out loud, or type it. Those expenses roll up into the spending figure the simulation uses. When your actual spending disagrees with your plan's assumption, you find out from your own data rather than from a bad year.
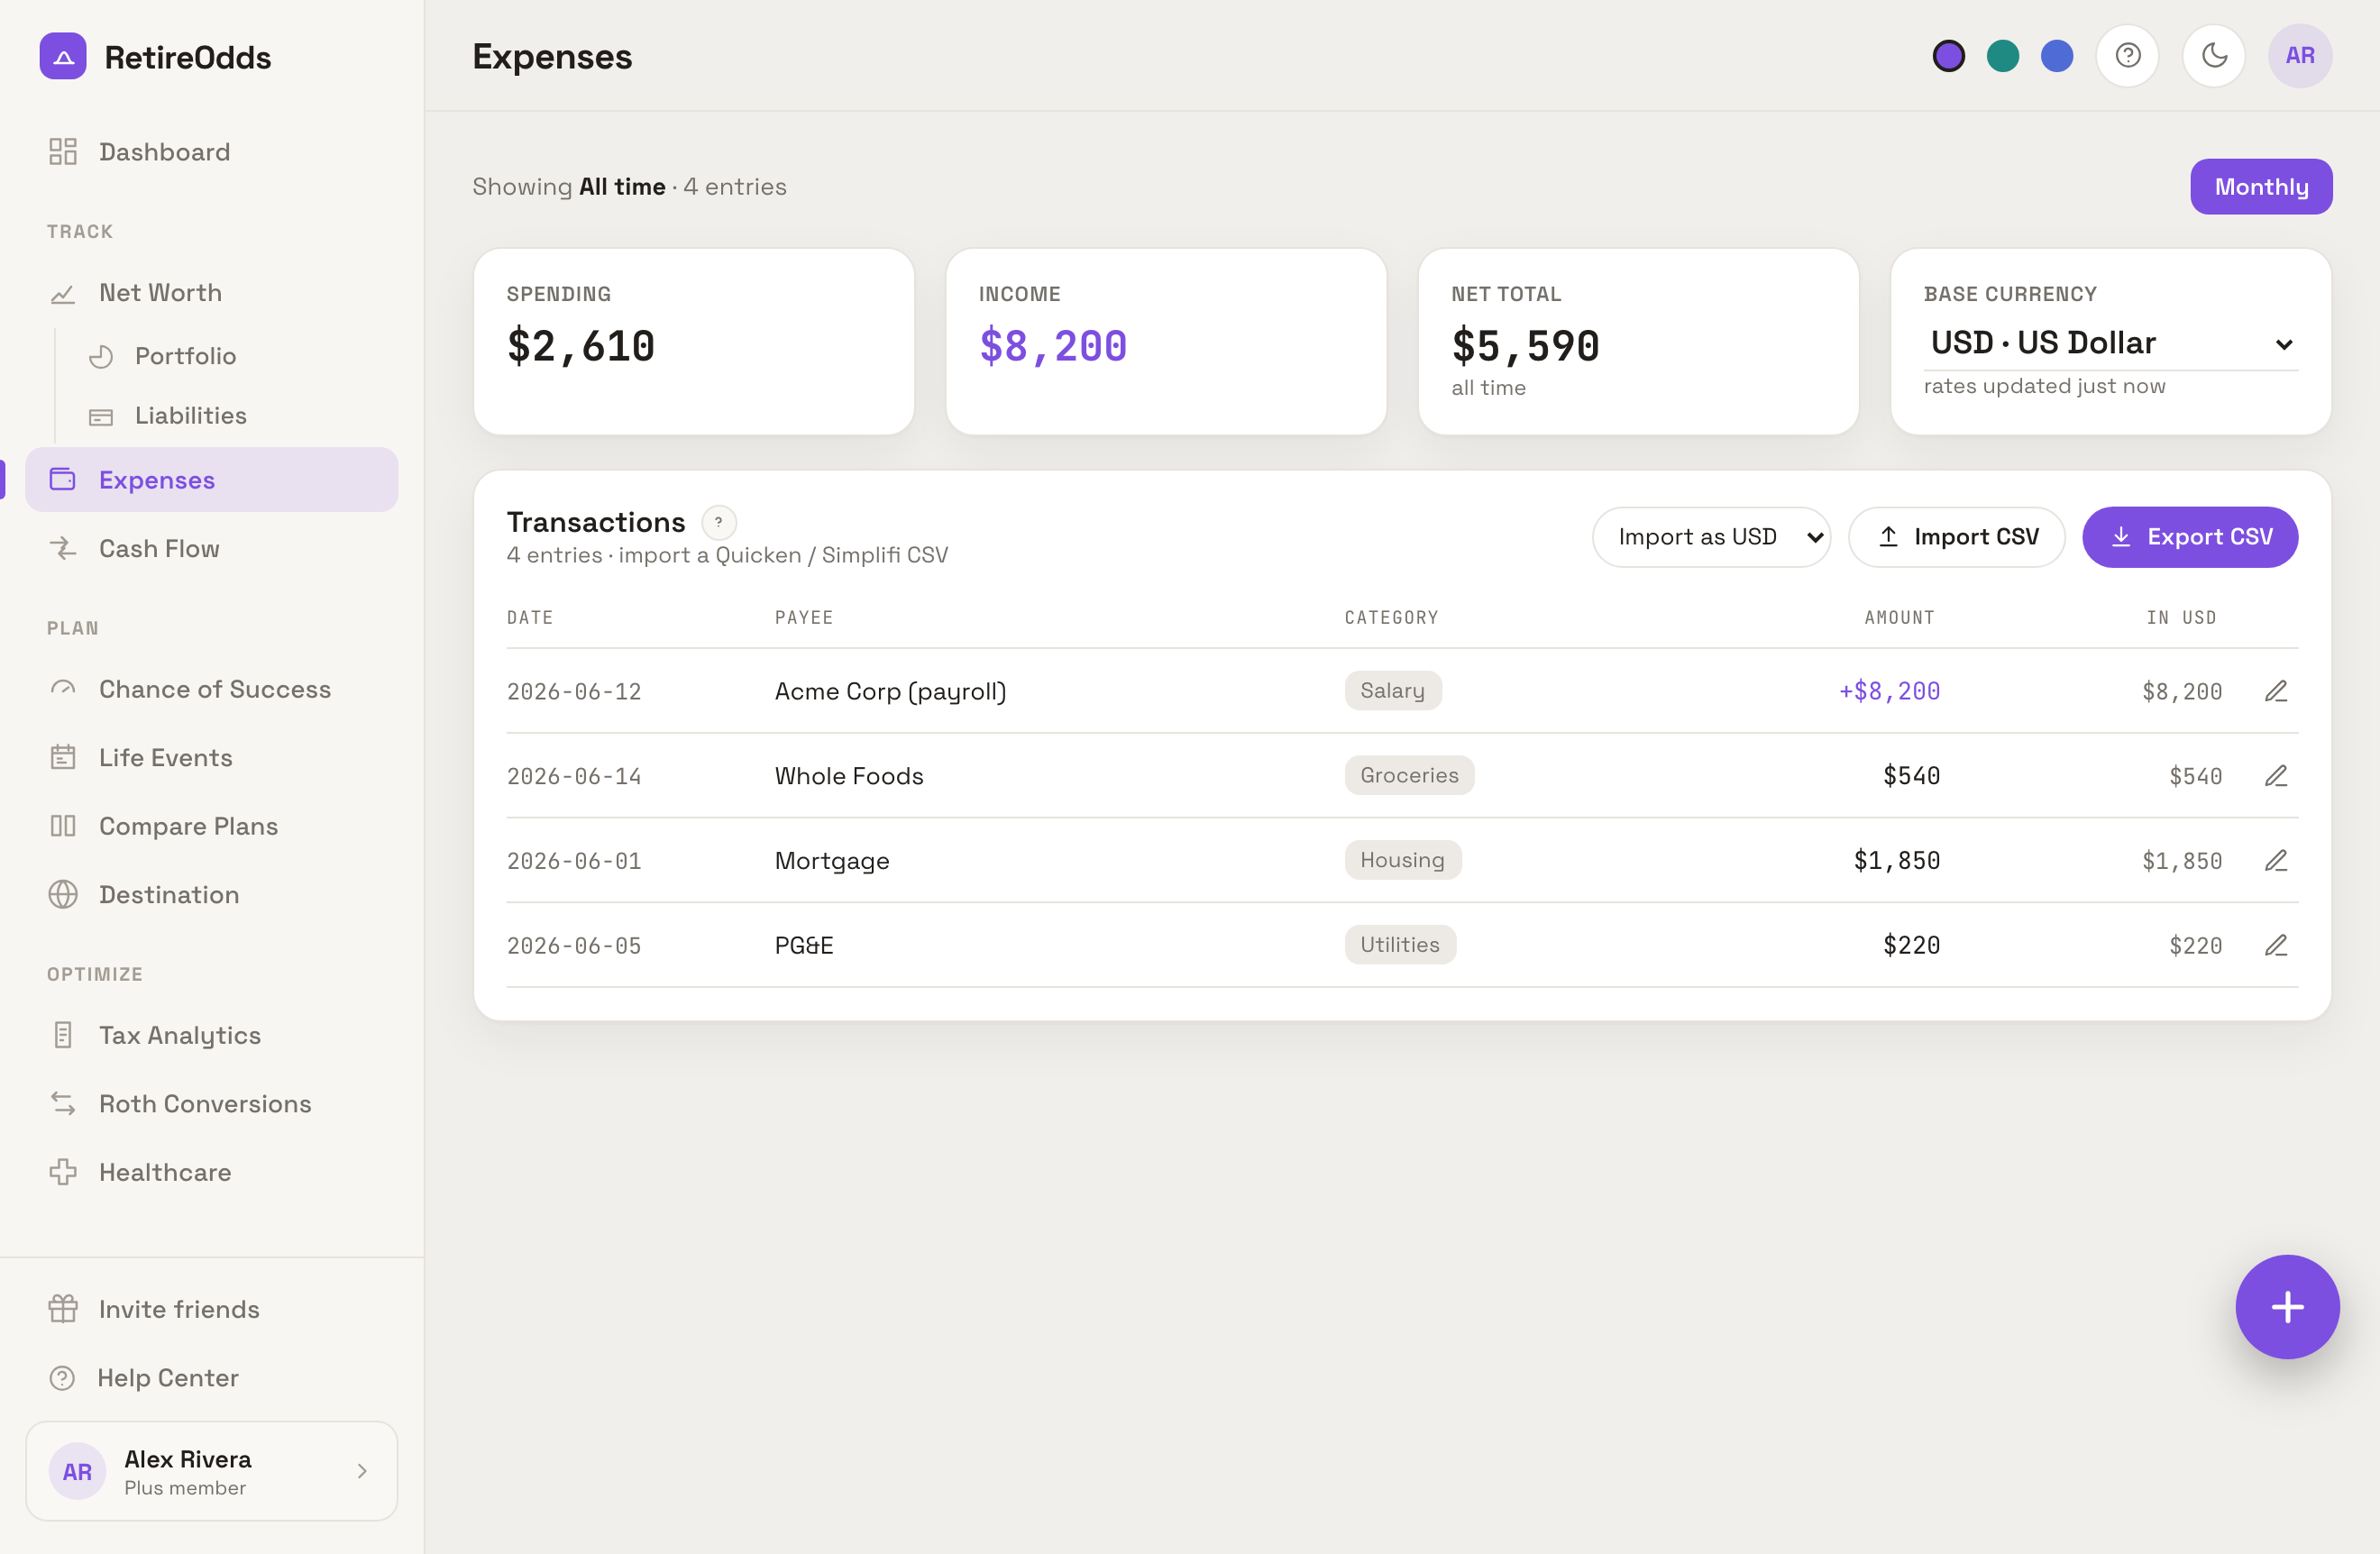
That connection is the point. A retirement projection is only as honest as its spending input, and a spending input is only honest if something keeps it current.
What you give up by choosing us
No coaching. A smaller input surface than a decade-old product. No advisor marketplace. We are a small team, and the roadmap is narrower on purpose: the model, its explanation, and the data that feeds it.
If you have read this far and the coaching line is the one that stuck with you, take Boldin's free tier for a spin — genuinely. If the line that stuck was "why does 2038 look bad," start with the Ledger.
Try both — it costs nothing
Both tools have a free path. Boldin's Basic tier is free and gives you the core planner. RetireOdds gives you 30 days of everything, with no card, and a free calculator that runs a real 1,000-path simulation without an account at all.
The test we would run, in either tool: put in your real numbers, find the year that looks worst, and try to explain it. Whichever tool lets you answer that question fastest is the one you should keep.
Common questions
Is RetireOdds a good Boldin alternative?
If what you want is a year-by-year plan you can audit — click any number and see its cause and its downstream effects — then yes. If what you want is coaching from a CFP or the widest possible set of input fields, Boldin is the stronger choice. Both run Monte Carlo simulations and both model taxes, Roth conversions and Social Security.
Is Boldin the same as NewRetirement?
Yes. NewRetirement rebranded to Boldin in 2024; PlannerPlus is the paid tier.
How much does Boldin cost compared to RetireOdds?
As of August 2026, Boldin PlannerPlus lists at $144 per year with a free Basic tier, and RetireOdds is $69 per year (or $199 once, for life) after a 30-day free trial that does not ask for a card. Check both sites for current pricing.
Does RetireOdds connect to my bank accounts?
It can import holdings and expenses, and it also works entirely on numbers you type in. The plan does not require account linking to produce odds.
Which is better for Roth conversion planning?
Boldin's Roth Conversion Explorer optimises against four named goals and is excellent for that. RetireOdds approaches it from the other end: you set a conversion in a year and the Ledger shows every downstream consequence — the bracket it fills, the ACA subsidy it trims, the RMD it shrinks — with each number traceable.


