
RetireOdds vs ProjectionLab: Two Ways to Model the Same Retirement
ProjectionLab is the most elegant plan-builder in this category. The question worth answering is what happens after you build the plan.
If you have spent an evening with ProjectionLab, you already know the thing everyone says about it: it is the nicest piece of financial modelling software in this category. The milestone system is genuinely well designed, the charts are beautiful, and the privacy stance — no account linking required — is a real position, not marketing.
We build RetireOdds. This guide is about a distinction that took us a while to articulate: building a plan and auditing one are different jobs, and the tools that are best at each look different.
The short version
| RetireOdds | ProjectionLab | |
|---|---|---|
| Best at | Explaining a plan year by year | Building a plan of unusual shape |
| Simulation | 1,000 Monte Carlo paths plus a deterministic median path published as a table | Monte Carlo up to 10,000 scenarios, historical backtesting |
| Signature feature | The Ledger — every money cell traces to its cause and its effects | Milestones with conditional logic and bindings between plan events |
| Privacy model | Account linking optional; encrypted at rest | Privacy-first: no linking required; self-hosting on paid tiers |
| Free tier | 30-day trial, no card + a free calculator with no account | Basic tier free (no saved plans) + sandbox mode |
| Price (Aug 2026) | $69/yr or $199 once | $129/yr, or $1,199 lifetime |
Prices are list prices checked on 1 August 2026 and do change — see ProjectionLab's pricing and ours.
Where ProjectionLab is the better tool
Your life doesn't fit a template. This is the real case for ProjectionLab. A sabbatical at 44, a rental sold when the second kid finishes college, a business exit that triggers a different withdrawal order — milestones with conditional logic model that cleanly, and bind to the start or end of other events. If you have ever fought a planner because your plan has an if in it, that is the product for you.
You want your data to stay yours, structurally. ProjectionLab doesn't require linking accounts, and paid users can self-host. That is a stronger privacy guarantee than a policy statement, and we respect it. RetireOdds encrypts at rest and works fine on typed numbers, but self-hosting is not something we offer.
You want to explore, not commit. Sandbox mode lets you drive the whole thing on a template persona without an account. It is one of the better trial experiences in personal finance software.
The difference: after the plan is built
Here is the moment we kept running into. You have modelled everything. The tool returns a number — a success probability, a net-worth curve. You look at year 2038, and it looks worse than you expected. Now what?
In most tools, including ones we admire, the answer is: go back to the inputs and change something, then compare the new number to the old one. That works, but it is a search, not an explanation. You are bisecting your own plan.
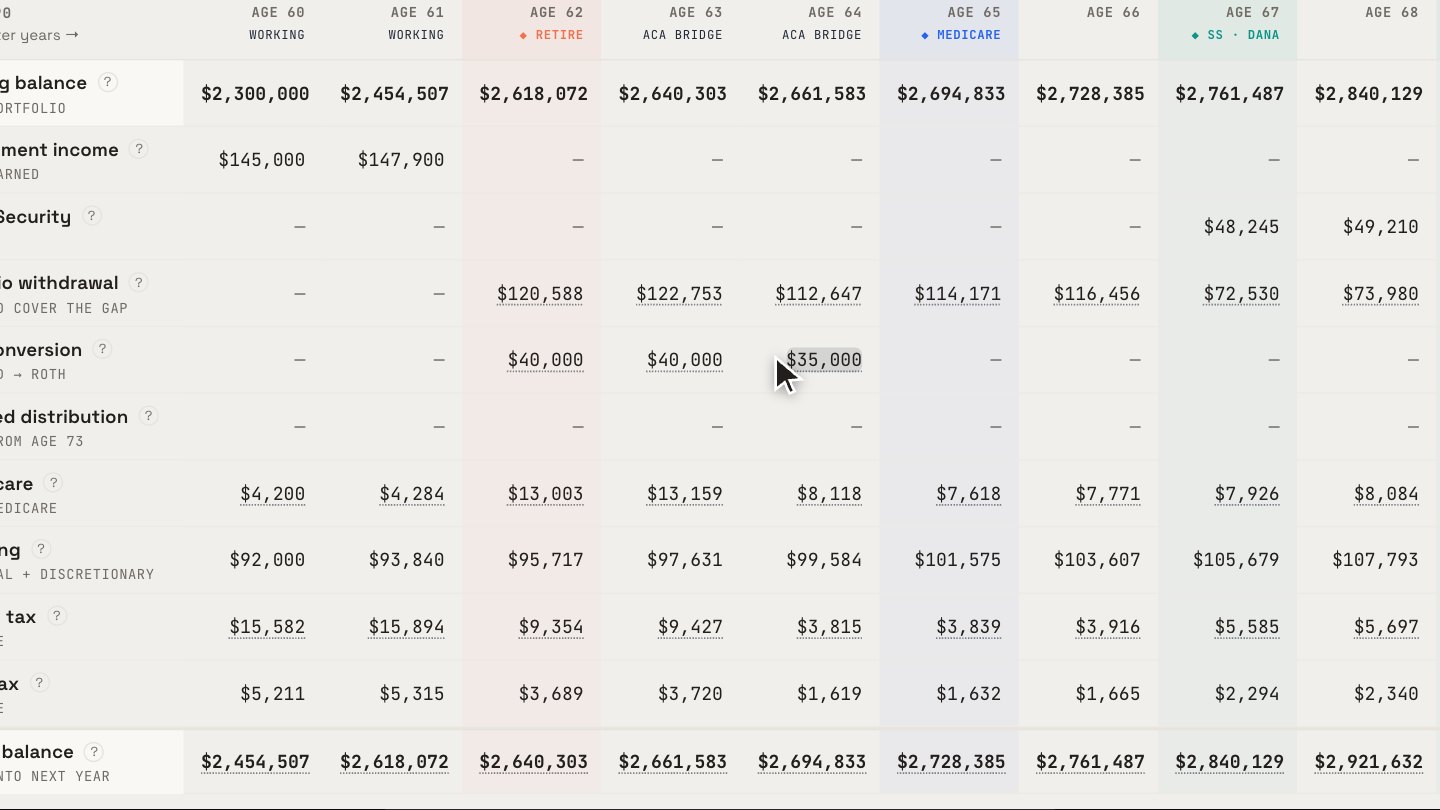
The Ledger answers why directly. Click a number and it shows you the cells that caused it and the cells it goes on to change. In the trace above, one decision — convert $40,000 or don't — is followed backward to the bracket it fills and forward to the ACA subsidy it trims and the required distribution it shrinks nine years later. Cross-domain effects like that are the ones a plan usually gets wrong, because tax, healthcare and withdrawal order are modelled in separate screens in most tools and in one row here.
Two structural properties make that possible: One engine, two outputs. The Ledger is the deterministic median path of the same simulation that produces your odds — not a second projection computed alongside it. So the table you read and the percentage you quote cannot disagree about assumptions.
Explicit warnings instead of silent defaults. When your inputs cannot support a clean answer, the Ledger says so — an opening balance it could not reconcile, an alternative asset with no valuation basis. We would rather show a gap than fill it with a default and hand you a confident number.
About simulation counts
ProjectionLab advertises up to 10,000 Monte Carlo scenarios; we run 1,000. It is worth being honest about what that difference buys.
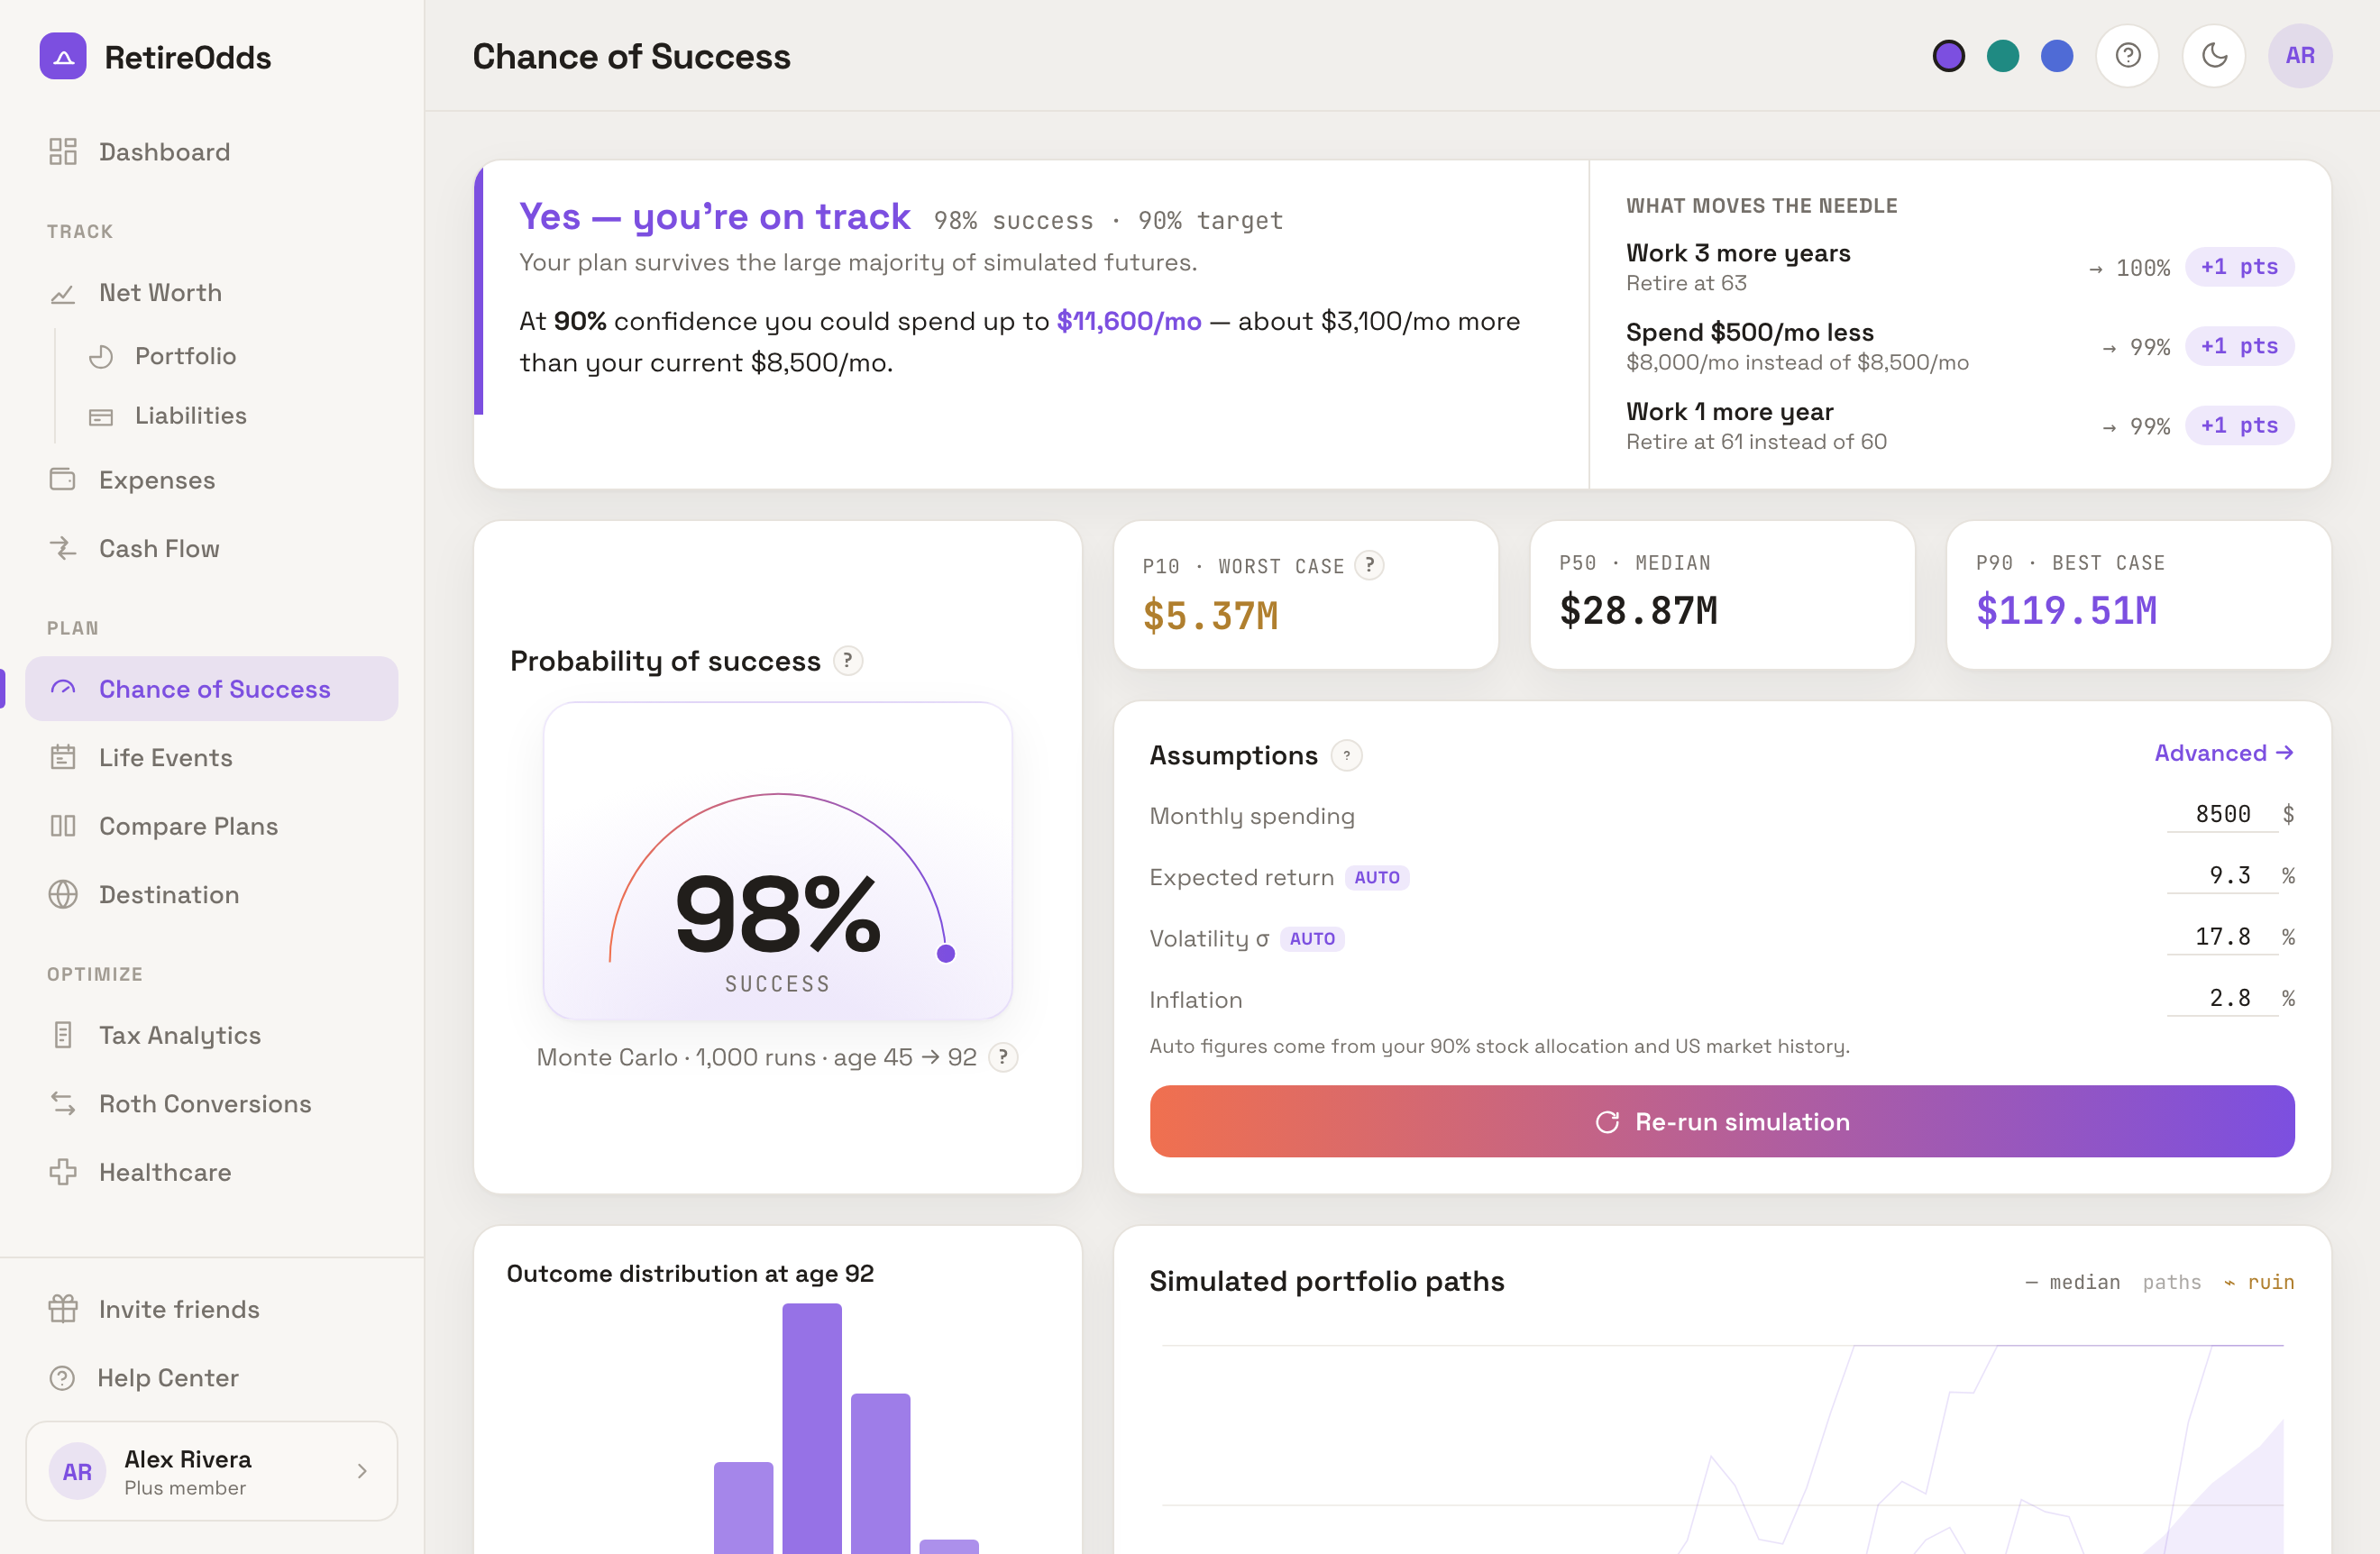
More paths reduce the sampling noise in the estimate. Past a few thousand, that noise is already small relative to the thing that actually dominates your result — the assumptions you fed in. A plan that is 84% at 1,000 paths and 84.3% at 10,000 has not become more correct; it has become more precisely wrong or more precisely right, depending entirely on whether your spending number is real.
Which is why we spent our effort on the assumptions instead. Every plan can produce an audit pack that discloses every assumption in force, and the "why this result?" panel reports which assumptions actually moved your odds and by how much — so you know whether your result hinges on the equity return you picked or on your spending, before you go read another chart.
Grounded in real spending, not a remembered number
Both tools are only as good as the spending figure you give them, and that figure is where most retirement plans quietly break. "We'll need about $6,000 a month" is a guess with a decimal point.
RetireOdds closes that loop inside the same product. Expenses are captured on the phone — scan a receipt and the items are read on-device, or say it, or type it — in whatever currency you happen to be spending. They roll into the same spending figure the simulation uses, so when reality drifts from the plan you learn it from your own data.
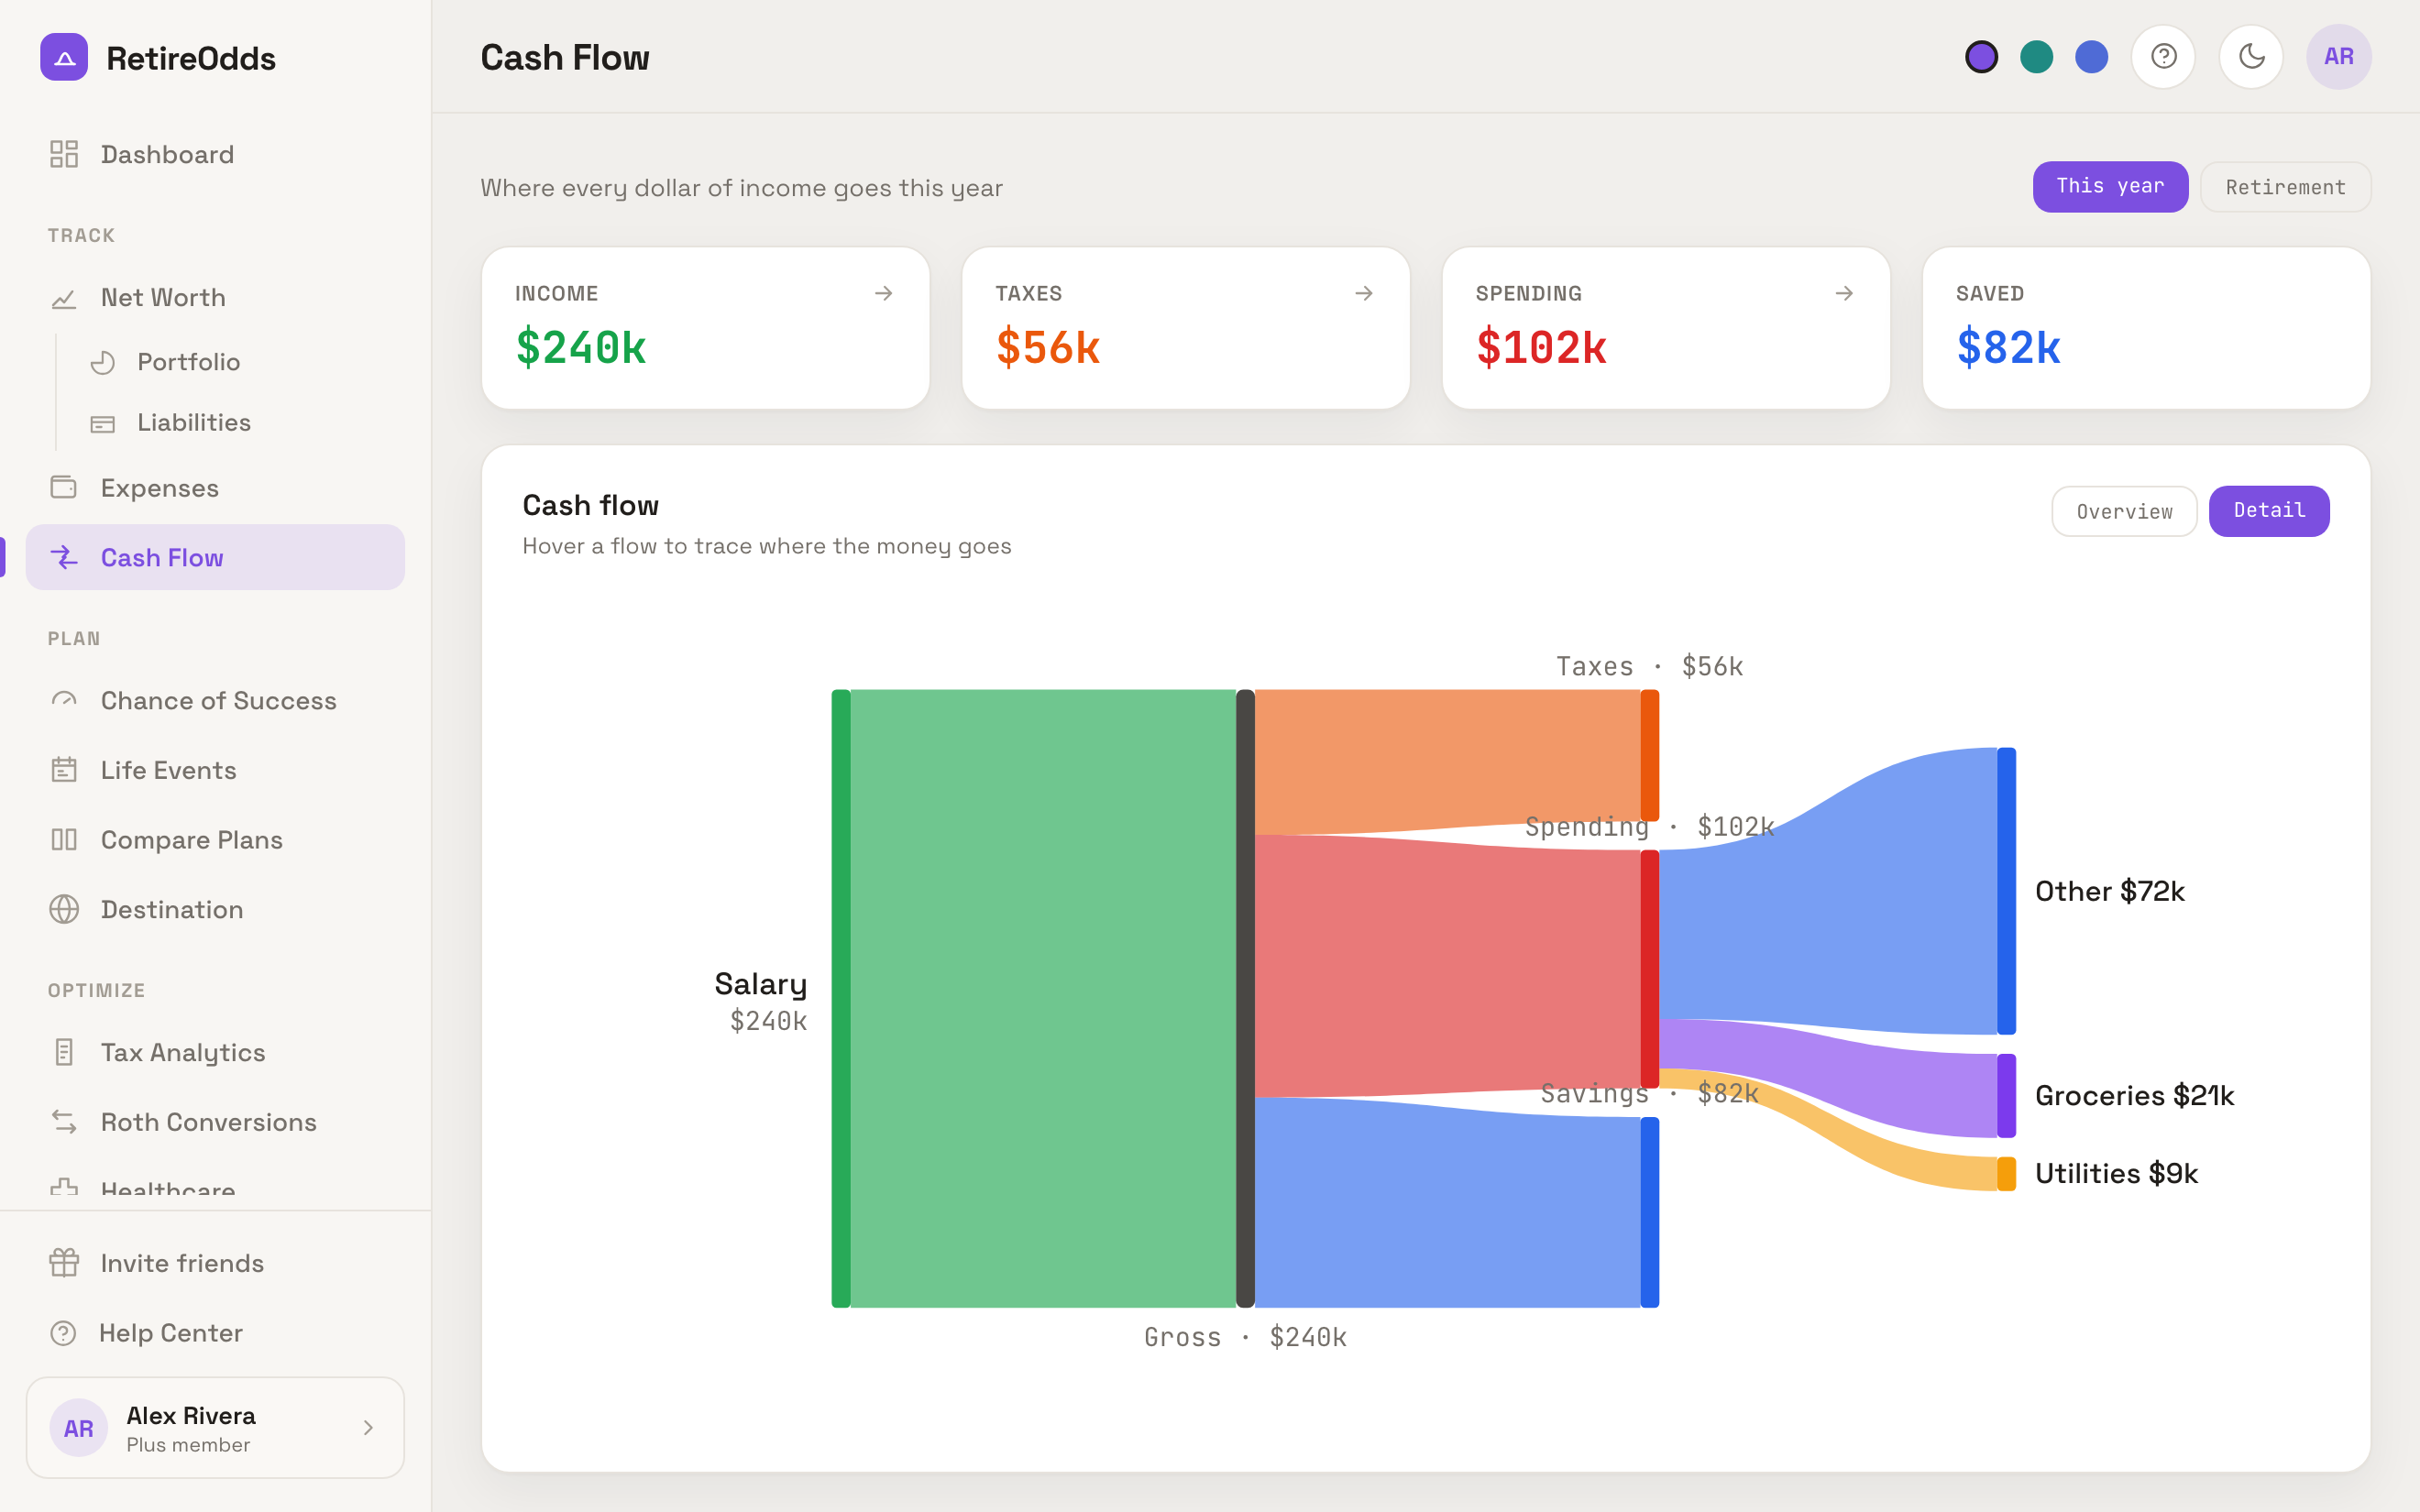
If you are the sort of person who will diligently maintain a spending model by hand, ProjectionLab will reward that discipline handsomely. If you would rather your plan stayed current because your actual spending flows into it, that is the case for us.
Honest recommendation
Use ProjectionLab if your plan has unusual structure, if self-hosting matters to you, or if you enjoy modelling for its own sake — it is a better canvas than ours.
Use RetireOdds if your plan is structurally ordinary but the stakes feel high, and what you want is to interrogate the result: which year is fragile, what is driving it, what changes if you convert in 2033 instead of 2035.
Plenty of people should try both. ProjectionLab's sandbox needs no account; our calculator runs a real simulation without one, and the trial is 30 days with no card.
Common questions
Is RetireOdds a good ProjectionLab alternative?
They optimise for different halves of the job. ProjectionLab is the better modelling canvas — milestones, conditional logic, unusual life shapes. RetireOdds is the better audit trail — a year-by-year Ledger from the same engine as your odds, where every number explains itself. If your plan is unusual, start with ProjectionLab. If your question is "why is this number what it is," start with RetireOdds.
Does ProjectionLab require linking bank accounts?
No. ProjectionLab is explicitly privacy-first and does not require account linking; paid users can choose cloud storage or self-hosting. RetireOdds also works without linking — you can type your numbers in.
How much does ProjectionLab cost versus RetireOdds?
As of August 2026 ProjectionLab Premium lists at $129 per year with a free Basic tier that does not save plans, plus lifetime access at $1,199. RetireOdds is $69 per year or $199 once, after a 30-day trial with no card. Check both sites for current pricing.
Which tool runs more Monte Carlo simulations?
ProjectionLab advertises up to 10,000 scenarios. RetireOdds runs 1,000 paths and adds something different: a deterministic median path published as a readable table, so the odds and the year-by-year plan come from one engine. More paths tighten the estimate; they do not explain it.
Can I try either without paying?
Yes. ProjectionLab has a free Basic tier and a sandbox mode that needs no account. RetireOdds has a free 30-day trial with no card and a free calculator that runs a real simulation without signing up.


