
What If the Market Crashes the Year You Retire?
Two retirees with identical plans can end up worlds apart based only on when the bad years hit.

The nightmare that kept Mona up one night was specific. We hand in our notices, throw a small party, sell some stock to cover the first year of spending, and then the market drops 30 percent. We are now selling more shares to fund the same lifestyle, out of a smaller pile, in our very first year of having no income. The question she asked was the right one: would our plan survive that, or only survive a polite, average future where nothing dramatic happens at the start?
Why timing beats the average
Most retirement math leans on an average return. Assume the market does, say, 7 percent a year, and the plan looks fine. The trouble is that markets do not deliver the average smoothly. They lurch. And in retirement, the order of those lurches matters enormously.
This is called sequence-of-returns risk, and here is the intuition. While you are saving, a crash early on is almost a gift, you buy cheap for years afterward. But once you are retired and withdrawing, a crash early on is the opposite of a gift. You are forced to sell assets while they are down to pay for groceries, and those sold shares can never recover. The portfolio that takes its losses in year one and its gains in year twenty can fail. The portfolio with the exact same returns in reverse order can thrive.
Same average. Same total set of yearly returns. Opposite outcomes, decided only by when the bad years land.
That is why "the market returns 7 percent on average" is a comforting and slightly dangerous sentence for a retiree. The average is real. It just does not protect you from a brutal first decade.
Stop staring at one future
The fix is to stop planning against a single tidy projection and start planning against many futures, including the ugly ones.
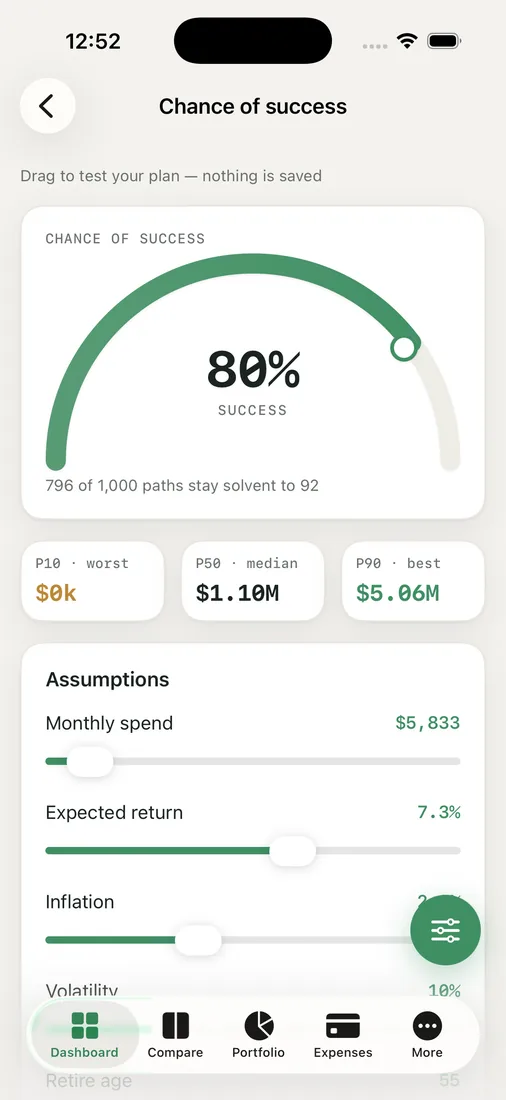
This is the whole reason the chance view in RetireOdds exists. Instead of one line, it runs a thousand possible paths for your money and reports a success percentage, the share of those futures in which you do not run out. It also shows P10, P50, and P90 bands, which is plain language for "the unlucky 10 percent, the middle, and the lucky 10 percent." All of it is shown in today's dollars, so the numbers actually mean something.
Crucially, it does not stop at one engine. It offers three: a random-normal simulation, a bootstrap that resamples real US market history, and a historical-sequence backtest that replays actual past sequences in order. That last one is the direct answer to Mona's nightmare, because it keeps the real clustering of bad years intact instead of smoothing it away.
What we actually do with it
For our family, the value is not the single headline number, it is the spread. We look at the bad tail and ask whether we could live with it. If a 30 percent first-year drop would still leave the plan standing, we can stop losing sleep. If it would not, we have choices we can make now while we still have options.
- We can hold a cash buffer so we are not forced to sell into the first downturn.
- We can build flexibility into our spending, trimming a little in bad years.
- We can shift our allocation around our retirement date so a crash hits a smaller share of the portfolio.

We are not predicting a crash, and nobody can. The point is humbler. A plan that only works if the early years are kind is not really a plan, it is a hope. Because we span currencies and countries, our "market" is messier than a single index anyway, which is one more reason we wanted to test against many futures rather than trust one neat average.
Key takeaways
- In retirement, the order of returns matters more than the average; an early crash while you are withdrawing can sink a plan that the same returns in reverse would not.
- This is sequence-of-returns risk, and it is invisible if you only model a single average return.
- Running many futures and reading the bad tail (the P10 band), not just the median, shows whether your plan survives the unlucky cases.
- A historical-sequence backtest is especially honest because it keeps real bad-year clustering intact.
If you are picking a retirement date, it is worth seeing what an early crash would do to you specifically. Run your own odds and look hard at the unlucky tail, not just the middle.


