
Can You Actually Retire at 55?
We ran our own numbers at 46 and asked the only question that matters: what are the real odds our money lasts if we stop working at 55?

The first time we wrote "55" on a whiteboard, it felt less like a plan and more like a dare. Mayur was 46, Mona was 43, the kids were 14 and 11, and we'd just moved again — US to Thailand to Singapore to Spain. Nine years to the finish line. The number under it was the one that kept us up: if we stopped earning at 55, would the money actually carry us through a retirement that might run forty years?
That gap — wanting to retire at 55, not knowing if it holds — is the whole reason RetireOdds exists.
Why "can I retire at 55" is really a probability question
Most retirement math you find online is a single straight line. You pick a return, say 6%, multiply it out, and the chart marches reassuringly upward. The problem is that real markets don't return 6% every year. They return 22%, then minus 18%, then 9%, in an order nobody can predict. Retire right before a bad stretch and that same plan can run dry; retire before a good one and you die rich.
So the honest version of "can I retire at 55" isn't yes or no. It's: out of every plausible future, in how many does our money outlast us? That's a percentage, not a promise.
Retiring at 55 sharpens the question because of one brutal detail: the gap years. From 55 to roughly 65 there's no Social Security, no Medicare, and in our case a stack of expenses in euros while some of our savings still think in dollars. Those early years do the most damage if markets misbehave, because every dollar we spend in a downturn is a dollar that never gets to recover.
What the simulation actually does
When we plug our plan into the Chance of Success screen, RetireOdds runs 1,000 different futures — a Monte Carlo simulation. Each path strings together a different sequence of returns and inflation, then spends our money down year by year and checks whether anything's left at the end.
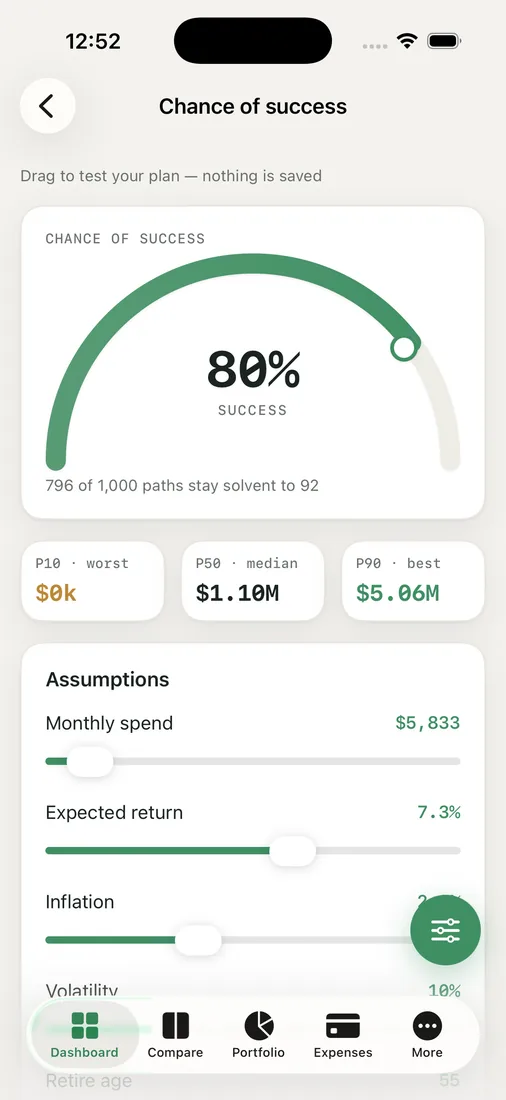
The gauge at the top is the headline: the share of those 1,000 paths where the money lasts. Below it are the P10, P50, and P90 bands — the rough worst case, the middle, and the rough best case. We pay most attention to the gloomy end. P50 is the story we hope for; P10 is the one we have to survive. And everything is shown in today's dollars, so a balance forty years out doesn't trick us with inflated numbers that buy half as much.
Moving the levers that matter
The part that turned "55" from a dare into a plan was the what-if sliders. We could nudge the retire age, our monthly spend, expected return, inflation, and volatility, and watch the gauge respond live.
A few things surprised us:
- Trimming monthly spend by a modest amount moved the odds more than chasing a higher return.
- Pushing the retire age out even a year or two had an outsized effect, because it shortens the spend-down and lengthens the saving.
- Flipping between the three engines — random-normal, a bootstrap of actual US history, and a straight historical backtest — kept us honest. If 55 only works under the rosiest engine, it isn't really working.

We're not going to pretend the screen handed us a guaranteed yes. It handed us something more useful: a number we could improve, and a clear view of which moves improved it most.
Key takeaways
- "Can I retire at 55" is a probability, not a yes/no — aim to know your odds, not to manufacture certainty.
- Early retirement lives or dies in the gap years before Social Security and Medicare, so stress-test the worst sequences hardest.
- Read results in today's dollars and watch the low end (P10), not just the average.
- Spending and retire age usually move your odds more than reaching for extra return.
Curious where 55 lands for your family? Run your own odds and watch the gauge move.


