
The Go-Go, Slow-Go, No-Go Spending Curve
Spending isn't flat in retirement. Modeling the three phases makes the plan far more realistic.

The first version of our plan assumed we'd spend the same amount, adjusted for inflation, every year from 51 to 90. We typed in one number and let it ride for forty years. Then we watched Mayur's parents actually retire, and the assumption fell apart. Their first retirement decade was full of flights and visits and a kitchen renovation. Their second was quieter. The third was quiet in a different way, with the savings showing up as a healthcare line instead. Spending wasn't flat. It had a shape — and our flat-line plan was modeling a person who doesn't exist.
The three phases, in plain English
Retirement researchers have a slightly goofy but very useful name for this shape: the go-go, slow-go, and no-go years.
The go-go years come right after you stop working. You're healthy, you have time, and you finally get to do the things the job blocked. Travel, projects, the trip you kept postponing. Spending is often higher than your working years, not lower.
The slow-go years follow. The big trips taper, not because the money's gone but because the appetite shifts. You're happy closer to home. Discretionary spending drifts down on its own.
The no-go years come last. Travel and big outings fade further — but a new category can rise to take their place: healthcare and support. The total might not drop as much as you'd hope, but its composition changes completely.
The honest summary is that retirement spending is usually higher early, lower in the middle, and shaped by health at the end. A single flat number gets all three wrong at once.
Why a flat line is the riskiest assumption
You might think a flat assumption is the safe, conservative choice. It usually isn't — it's just wrong in two directions that partly cancel out and hide each other.
A flat number understates the go-go years, when we'll actually want to spend more, so the early plan looks rosier than reality. And it can overstate the slow-go middle, when we'll naturally spend less, so the plan demands a bigger nest egg than we truly need. The two errors don't neatly offset; they just make the whole projection mushy.
Modeling the phases sharpens it. We get a higher early target we can stress-test against bad early markets — which is exactly when overspending hurts most — and a realistic taper that doesn't force us to over-save for a lifestyle we won't lead.
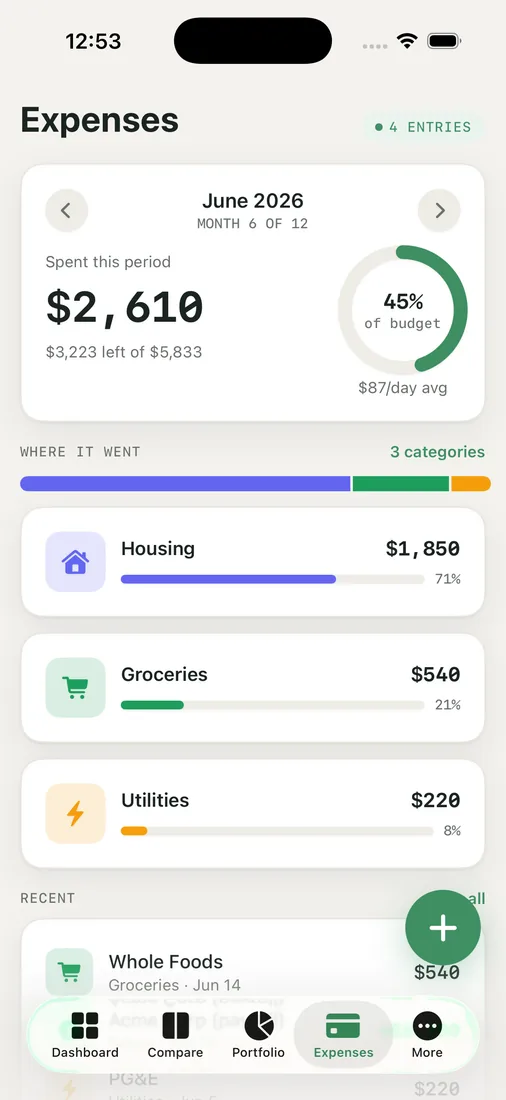
How we model the phases in RetireOdds
In the Expenses view, we don't have to commit to one number for all of retirement. We model spending in phases — a higher go-go level for the first stretch, a step down for the slow-go years, and an adjusted no-go level that quietly grows the healthcare side. Everything stays in today's dollars and per currency, so the shape is about real lifestyle, not inflation arithmetic we have to do in our heads.
Then the Chance of Success Monte Carlo runs that shape through 1,000 market paths instead of a flat line. The P10, P50, and P90 results mean more this way, because the plan being tested is one a real person might actually live.
What changed for us
When we switched from a flat number to a phased one, two things happened. Our early-retirement spending target went up, which was uncomfortable but honest — we do plan to front-load the adventures while the kids still want to come along. And our overall required nest egg came down a little, because the flat assumption had been quietly funding decades of go-go spending we'd never actually do.

Neither change was about spending less or more in total. It was about putting the money where the living actually happens. A plan shaped like a real life is simply easier to trust.
Key takeaways
- Retirement spending typically isn't flat — it's higher in the active go-go years, lower in the slow-go middle, and reshaped by healthcare in the no-go years.
- A single flat number understates early spending and overstates the middle, making the whole projection less reliable, not more conservative.
- Modeling spending in phases, in today's dollars and per currency, lets the Monte Carlo test a plan a real person would actually live.
- Phasing often raises your early target and lowers your overall required nest egg at the same time — it's about where the money goes, not just how much.
Does your plan assume you'll spend the same at 80 as at 55? Run your own odds with a curve that bends like real life.


