
Inflation Isn't One Number for Everyone
Your personal inflation depends on what you buy and where you live. We plan in today's dollars, per currency.

The headline said inflation was running around 3%. That same month, the kids' international-school fees went up 7%, our Spanish electricity bill jumped, and the price of the flights we take to see family in the US barely moved. So which number were we supposed to plug into a thirty-year plan? None of them, it turns out. The official figure is a national average of a basket that isn't ours. Our real inflation depends on what we buy and where we live — and for a family spread across currencies, it isn't even a single number.
Why the headline number isn't yours
A national inflation figure is an average across a giant, standardized basket of goods — housing, food, fuel, transport, electronics — weighted to represent a typical household in one country. That's useful for central bankers. It's only loosely related to your life.
Your personal inflation rate is driven by your basket. If a big share of your spending sits in categories rising faster than average — education, healthcare, certain housing markets — your real rate runs hotter than the headline. If you're weighted toward things that are flat or falling, you run cooler. The 3% on the news is a fact about the country, not about you.
For us the gap is stark, because two of our largest line items — kids' schooling now and college soon — have historically climbed well above general inflation, while other parts of our spending have been tame.
The currency layer on top
Then there's the part most inflation conversations skip entirely: we don't live in one currency. We spend in euros, dollars, and Singapore dollars depending on the year.
Each of those economies has its own inflation rate. Euro-zone prices and US prices don't move together, and the exchange rate between them drifts on top of that. So our "inflation" is really a blend — several local rates, weighted by how much of our life happens in each currency, with the FX layer adding its own wobble. Collapsing all of that into one global number would bury exactly the differences that matter to us.
How we keep it honest: today's dollars, per currency
The trick we lean on is planning in today's dollars. Instead of trying to predict what a restaurant meal will cost in 2050 and reasoning about scary future totals, we describe everything in money we understand right now. The model handles the inflating behind the scenes, so the numbers we read and adjust always feel real.
Crucially, it does this per currency. Our euro spending inflates on a euro assumption, our dollar spending on a dollar assumption. The categories that run hot for us — schooling, college — can carry their own faster rate rather than being dragged toward a single average that flatters them.
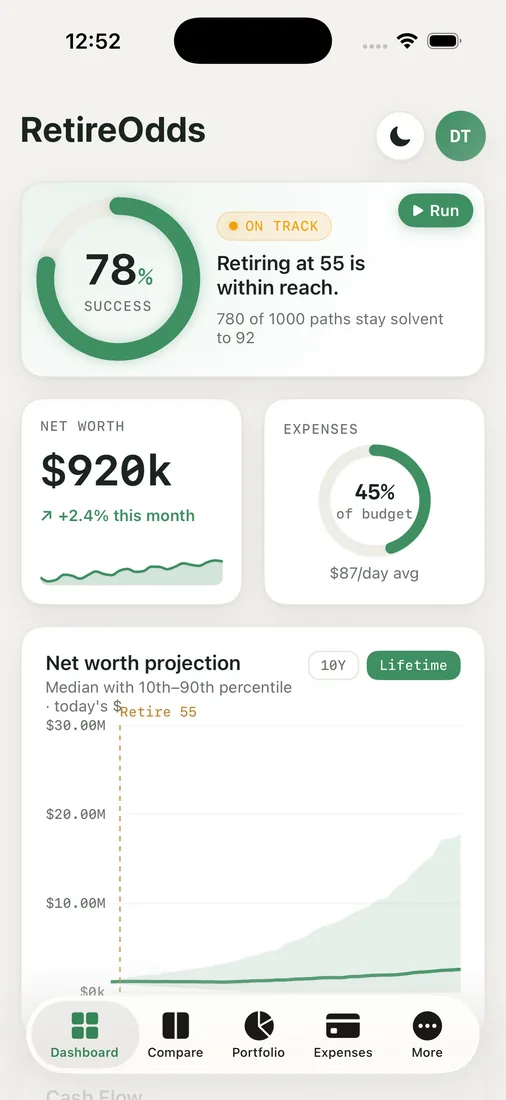
The dashboard then shows the projection in those familiar today's-dollar terms, so a net-worth or spending line years out still means something at a glance instead of being an inflated number we have to mentally deflate.
Why this matters for the odds
Inflation is one of the quietest, most powerful forces in a long retirement, because it compounds. A plan that assumes 2% when your real basket runs 4% will look healthy for years and then quietly fall short. By letting different categories and different currencies carry their own assumptions, the Chance of Success Monte Carlo stress-tests against a more honest erosion of our money — not a single optimistic average.
We'd rather discover a too-rosy inflation assumption now, on a screen, than in our seventies when the fees have outrun the plan.

So we stopped chasing the headline number. It was never ours to begin with. Our plan runs on our basket, in our currencies, expressed in dollars we can actually picture — and that's a far steadier thing to build thirty years on.
Key takeaways
- The national inflation figure is an average of a standardized basket — your real rate depends on what you buy and can run hotter or cooler.
- Categories like education and healthcare often outpace the headline, so letting them carry their own rate keeps the plan honest.
- For multi-currency households, "inflation" is a blend of local rates plus FX drift — model it per currency, not as one global number.
- Planning in today's dollars accounts for inflation everywhere while keeping the figures readable, so your success odds are tested against realistic erosion.
Is your plan running on someone else's inflation rate? Run your own odds on your basket, in your currencies.


