
Snowbird Math: Half the Year Abroad
Six months in the US, six months abroad — how a blended cost of living changes the spending plan.

A few summers ago we ran an accidental experiment. We spent June and July back in the US near family, then flew to our place in Spain for the rest of the year. When the dust settled, we added it up: roughly $6,200 a month for the US stretch, and closer to $3,400 a month once we were back in Valencia. Same family, same habits, wildly different number. That gap is the whole story of snowbird math, and most retirement plans never account for it.
The trap of a single monthly number
When you build a retirement plan, the tool usually asks for one figure: "How much do you spend per month?" For a household that lives in one place, that question is fair. For anyone splitting the year across two cost-of-living worlds, it quietly forces a bad average.
If we'd just typed in "$4,800" — the rough blended average of our two seasons — the plan would look fine on paper but be wrong in a specific way. It would overstate our cheaper months and understate the expensive ones, and it would completely miss that the expensive months are denominated in dollars while the cheap months are mostly in euros. A single number erases both the seasonality and the currency.
What blended cost of living actually means
Blended cost of living is just the honest weighted average of how you really live across the year. The arithmetic is simple. The discipline is remembering to do it at all.
For us, half the year at about $6,200 and half at about $3,400 works out to roughly $57,600 a year, or $4,800 a month on average. The blended figure is the same $4,800 we might have guessed — but now we know why, and we can pull the two halves apart when we need to.
That matters because the two halves move independently. A strong dollar makes our Spanish months cheaper without touching our US months. A bad US healthcare year inflates the expensive half without touching the cheap one. When the inputs are split, we can stress-test each one. When they're mashed into a single average, we're flying blind.
How we model it in RetireOdds
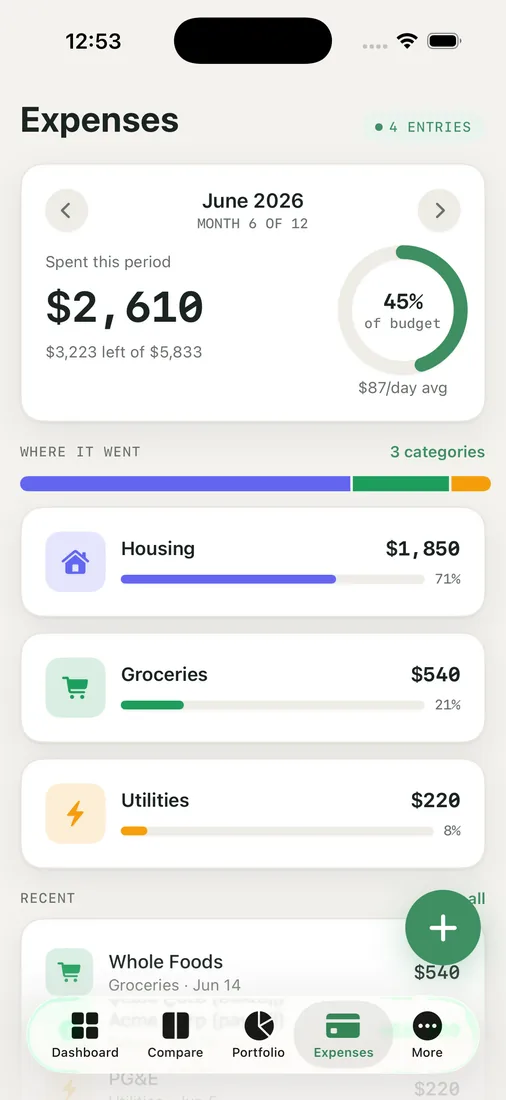
In the Expenses view, we don't enter one blended line. We enter the categories the way we actually spend them, tagged to the currency they're paid in — US rent, US healthcare, and travel in dollars; Spanish housing, groceries, and day-to-day life in euros. The budget ring at the top shows the real blended total, but underneath, every line keeps its own currency.
The payoff shows up everywhere downstream. Our Cash Flow Sankey splits the river of money by where it goes, so the expensive US season is visibly its own tributary. And when we run the Chance of Success Monte Carlo, the plan is being tested against a realistic spending shape, not a flattened guess. The monthly-spend slider becomes genuinely useful here: we can nudge just the US half down by trimming the time we spend there, and watch the odds respond.
The lever hiding in the calendar
Here's the part that surprised us. For a snowbird, time itself is a spending lever. Shifting from six months in the expensive country to five months — one extra month in the cheaper one — changed our annual spend by close to $2,800 in our example. We didn't cut a single latte. We just rebalanced the calendar.
We tested exactly that as a what-if. Moving one month from the dollar season to the euro season nudged our success odds up by a few points — not life-changing, but free, and it stacked with everything else we were already doing.

None of this is advice about where you should live. It's just a reminder that if your year has two financial seasons, your plan should too. A blended number hides the seasons; splitting them gives you back the steering wheel.
Key takeaways
- If you split the year across two cost-of-living worlds, a single average monthly number hides both the seasonality and the currency mix.
- Build a blended cost of living from the real two halves, and keep each half in its own currency so a strong dollar or a bad healthcare year shows up where it belongs.
- For snowbirds, the calendar is a spending lever — shifting a month from the expensive country to the cheaper one can move your annual spend by thousands.
- Modeling expenses per category and per currency makes your success odds reflect how you actually live, not a flattened guess.
If your year has two seasons, give your plan two seasons too — run your own odds and see how the split changes the picture.


